Mapping erosion along CT shoreline is difficult due to the access challenges presented by the marshes. Additionally, the change detection is monitored in centimeters so very accurate – survey grade – models are required to identify changes in thin layer placement. Further, multiple flights annually over a large area of interest is required for useful change detection results.
Objective: Autonomously map and provide change detection metrics for elevations in the marshes. Track thin layer placement changes and identify the success rate of the manually increased sediment elevations for protecting identified assets such as Salt Marsh nesting sites.
Using machine learning, autonomously identify vegetation types like Phragmites, Spartina Patens, Spartina Atlernaflora, and Salicornia, then track changes in health and location over time.
Challenge: Gaining baseline data of existing thin layer sediment, the best known locations of Salt Marsh Sparrow nest sites, and mapping where and what types of sea grass are currently growing across the area of interest has in the past been a very manual task, which historically required human access to the marsh. Trending analysis needs data to be logged frequently over time; therefore, a more efficient approach of gathering the information on a recurring basis is required. Our challenge was to confirm that flying high-precision UAS to aerially collect data that had previously been collected solely from the ground could capture metrics of these marsh assets at an equivalent or even improved level.
Project Specs:
Client: University of Connecticut, Dept. of Ecology & Evolutionary Biology
Collection Services: Aerial LiDAR, Multispectral and Orthomosaic
Processing and Analysis: High resolution orthomosaics, DTM, DSM, Elevation contours, Classified point clouds, Vegetation classifications, Nest site identification, Change detection, Broad range indices generation, Biomass identification

Change Detection – The erosion mapping effort proved that we can in fact detect within centimeter ranges: a) the rise of tidal water, b) potential locations of the nest sites, and c) vitality of the existing salt tolerant grass and sedge species. We posit that d) automation is key to modeling change, and e) machine learning can completely automate this inventory on a recurring basis to accurately monitor the erosion impacts on this coastal area.
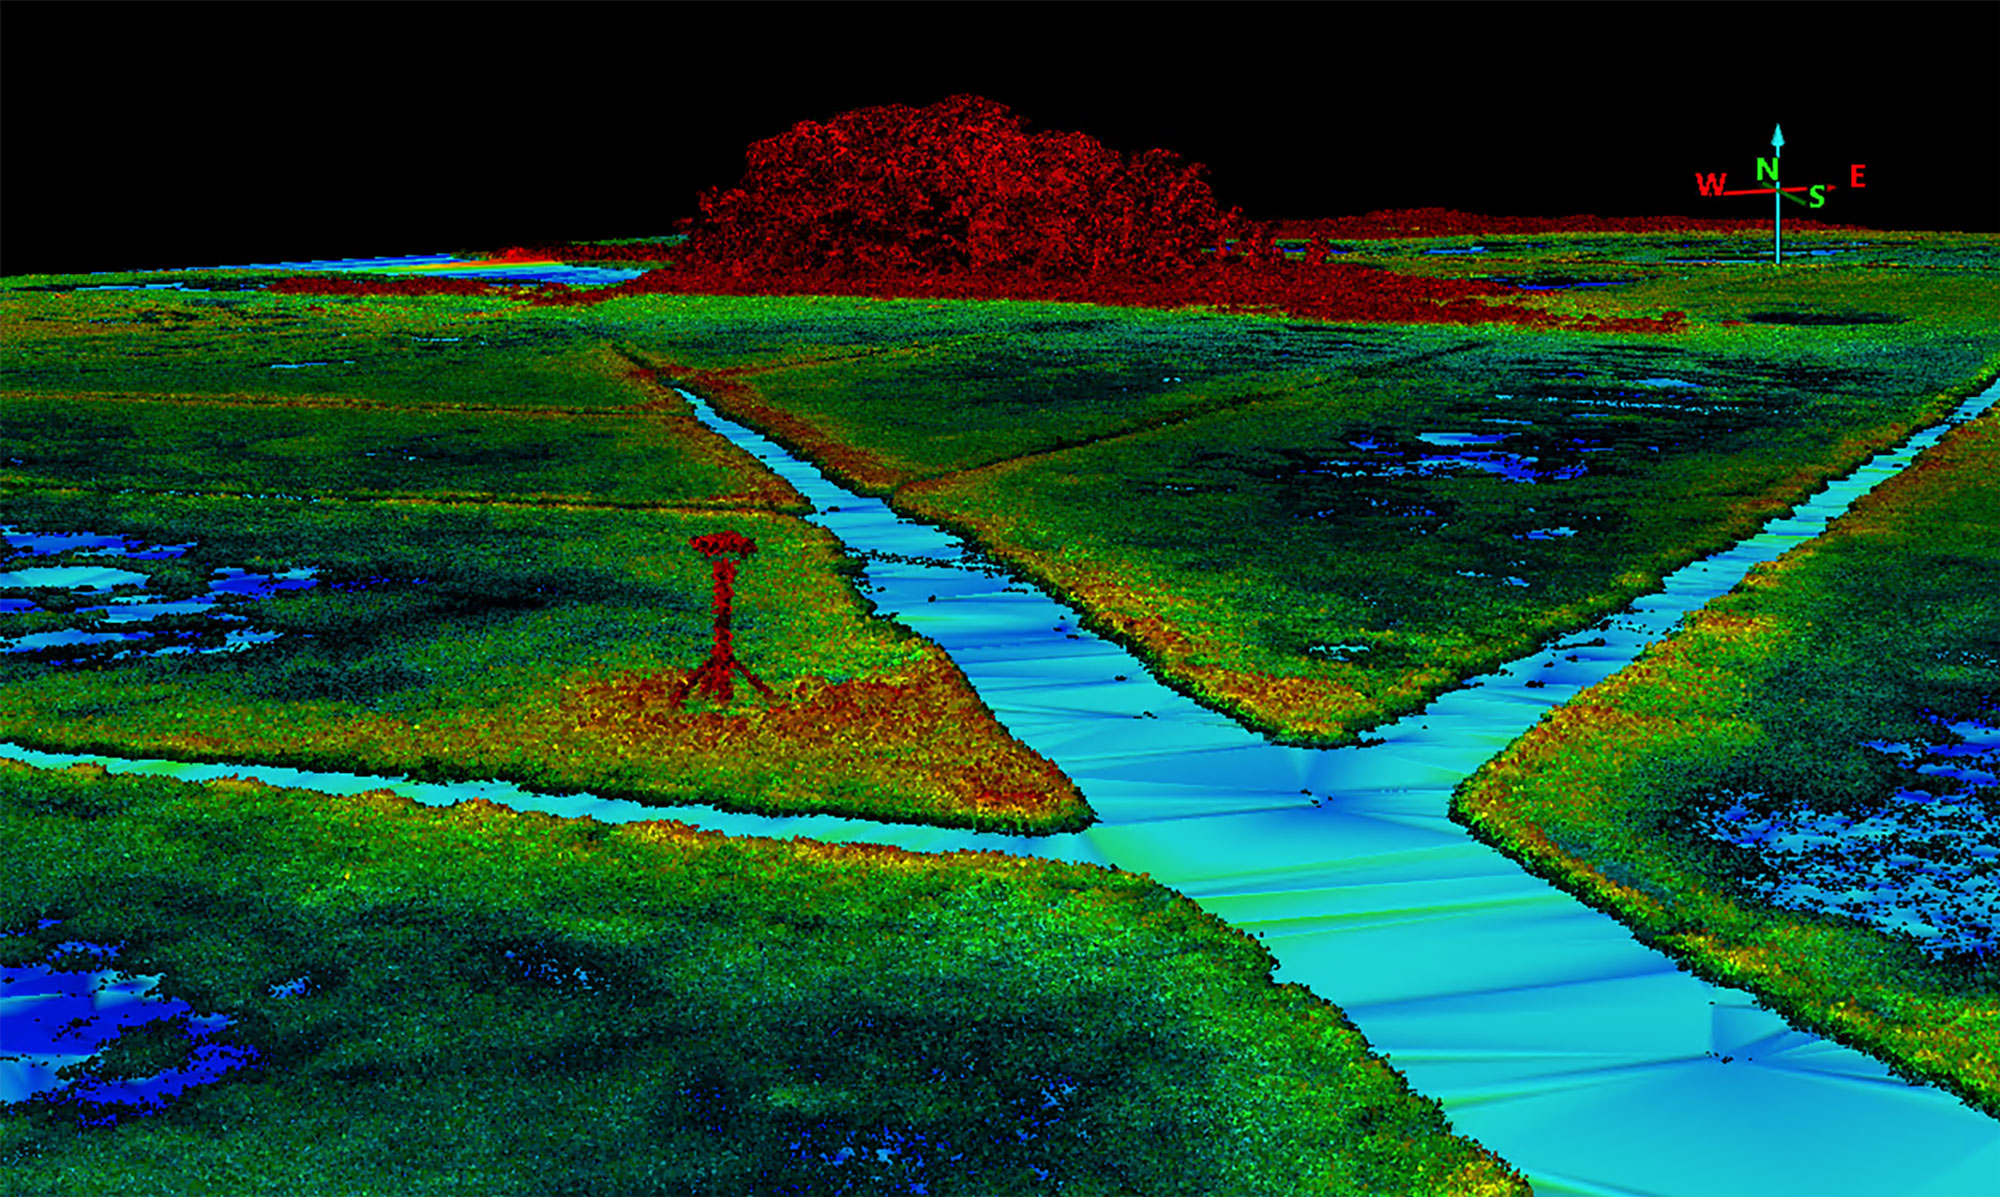
Barn Island Point Cloud with DTM
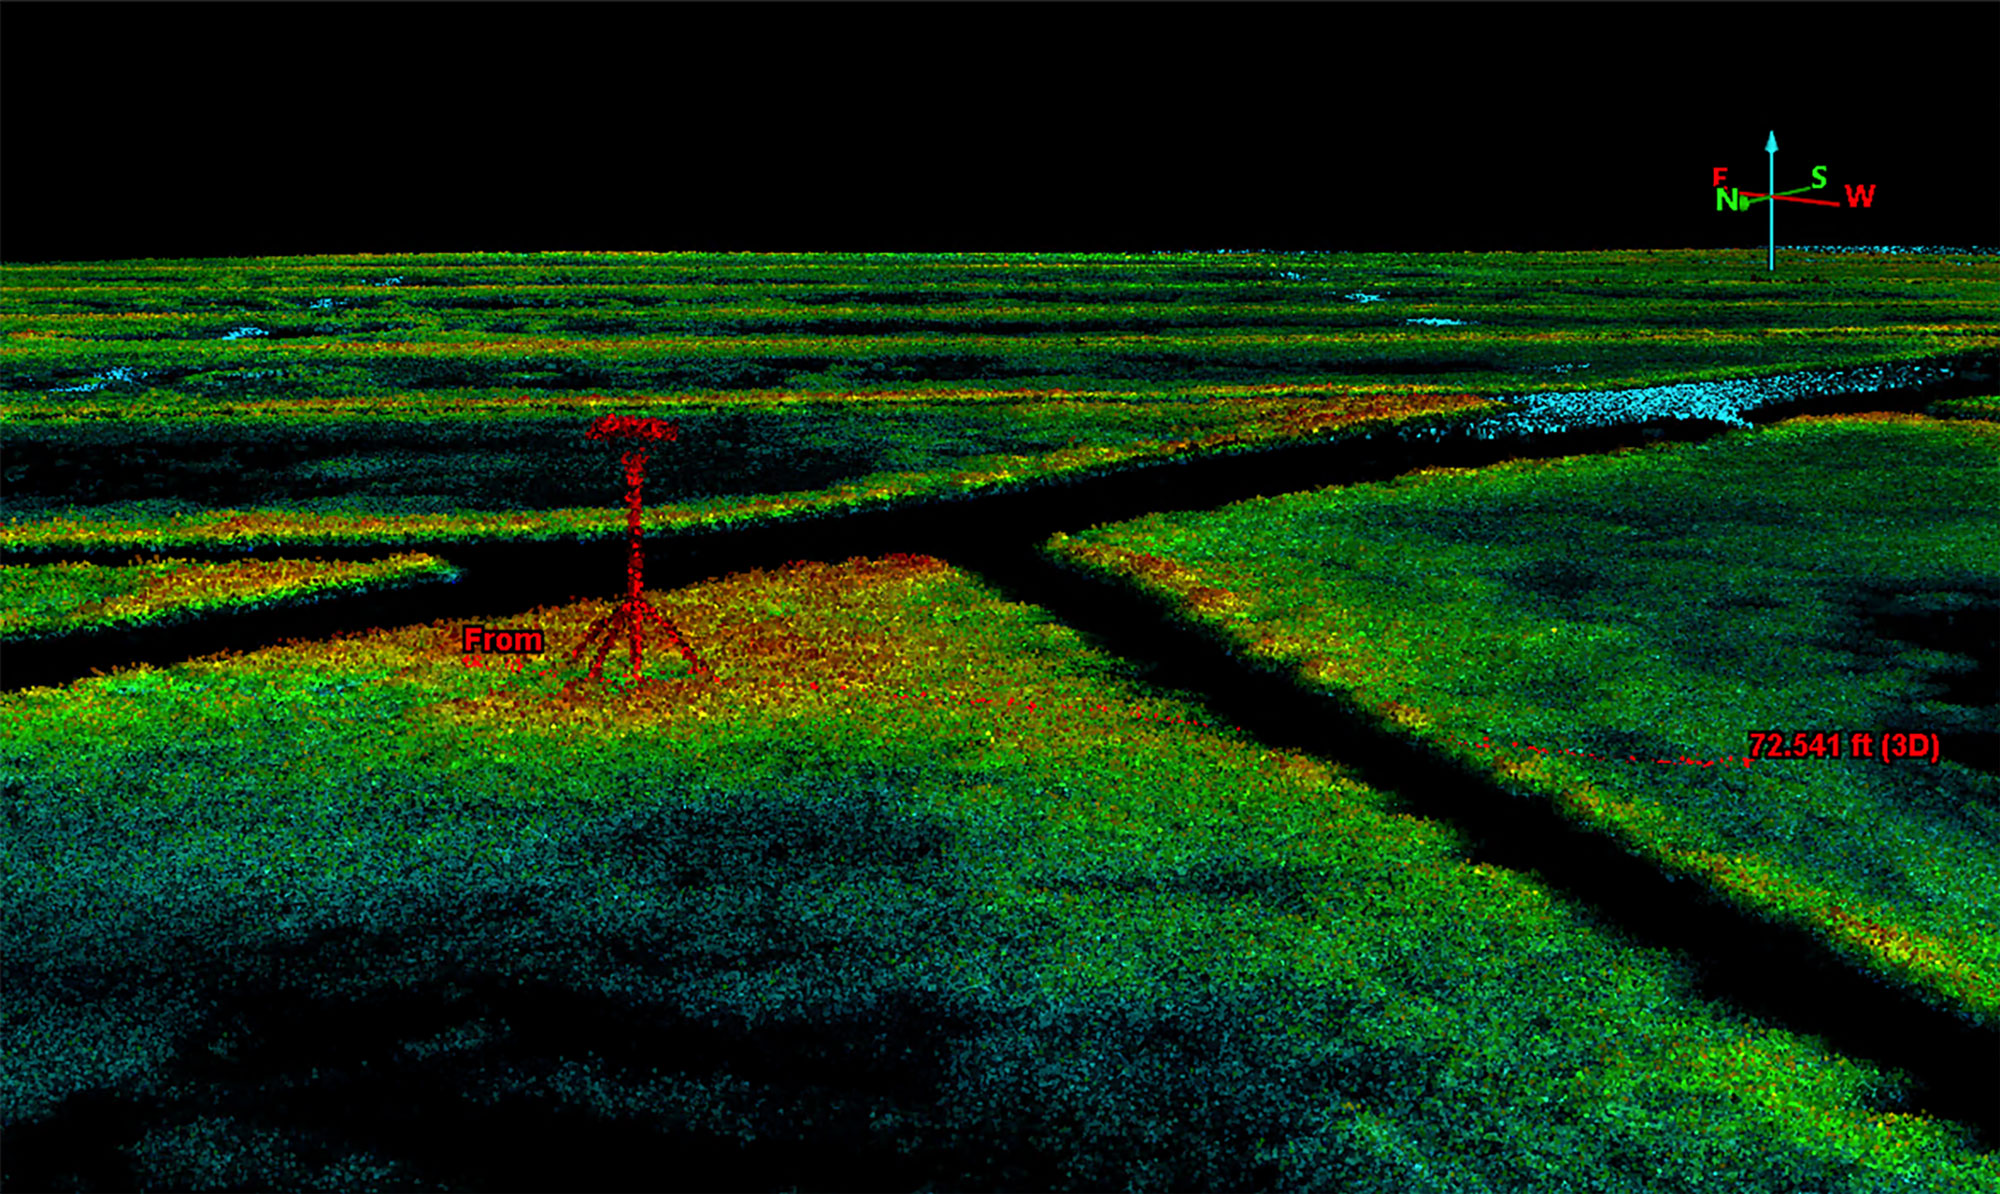
Barn Island Point Cloud
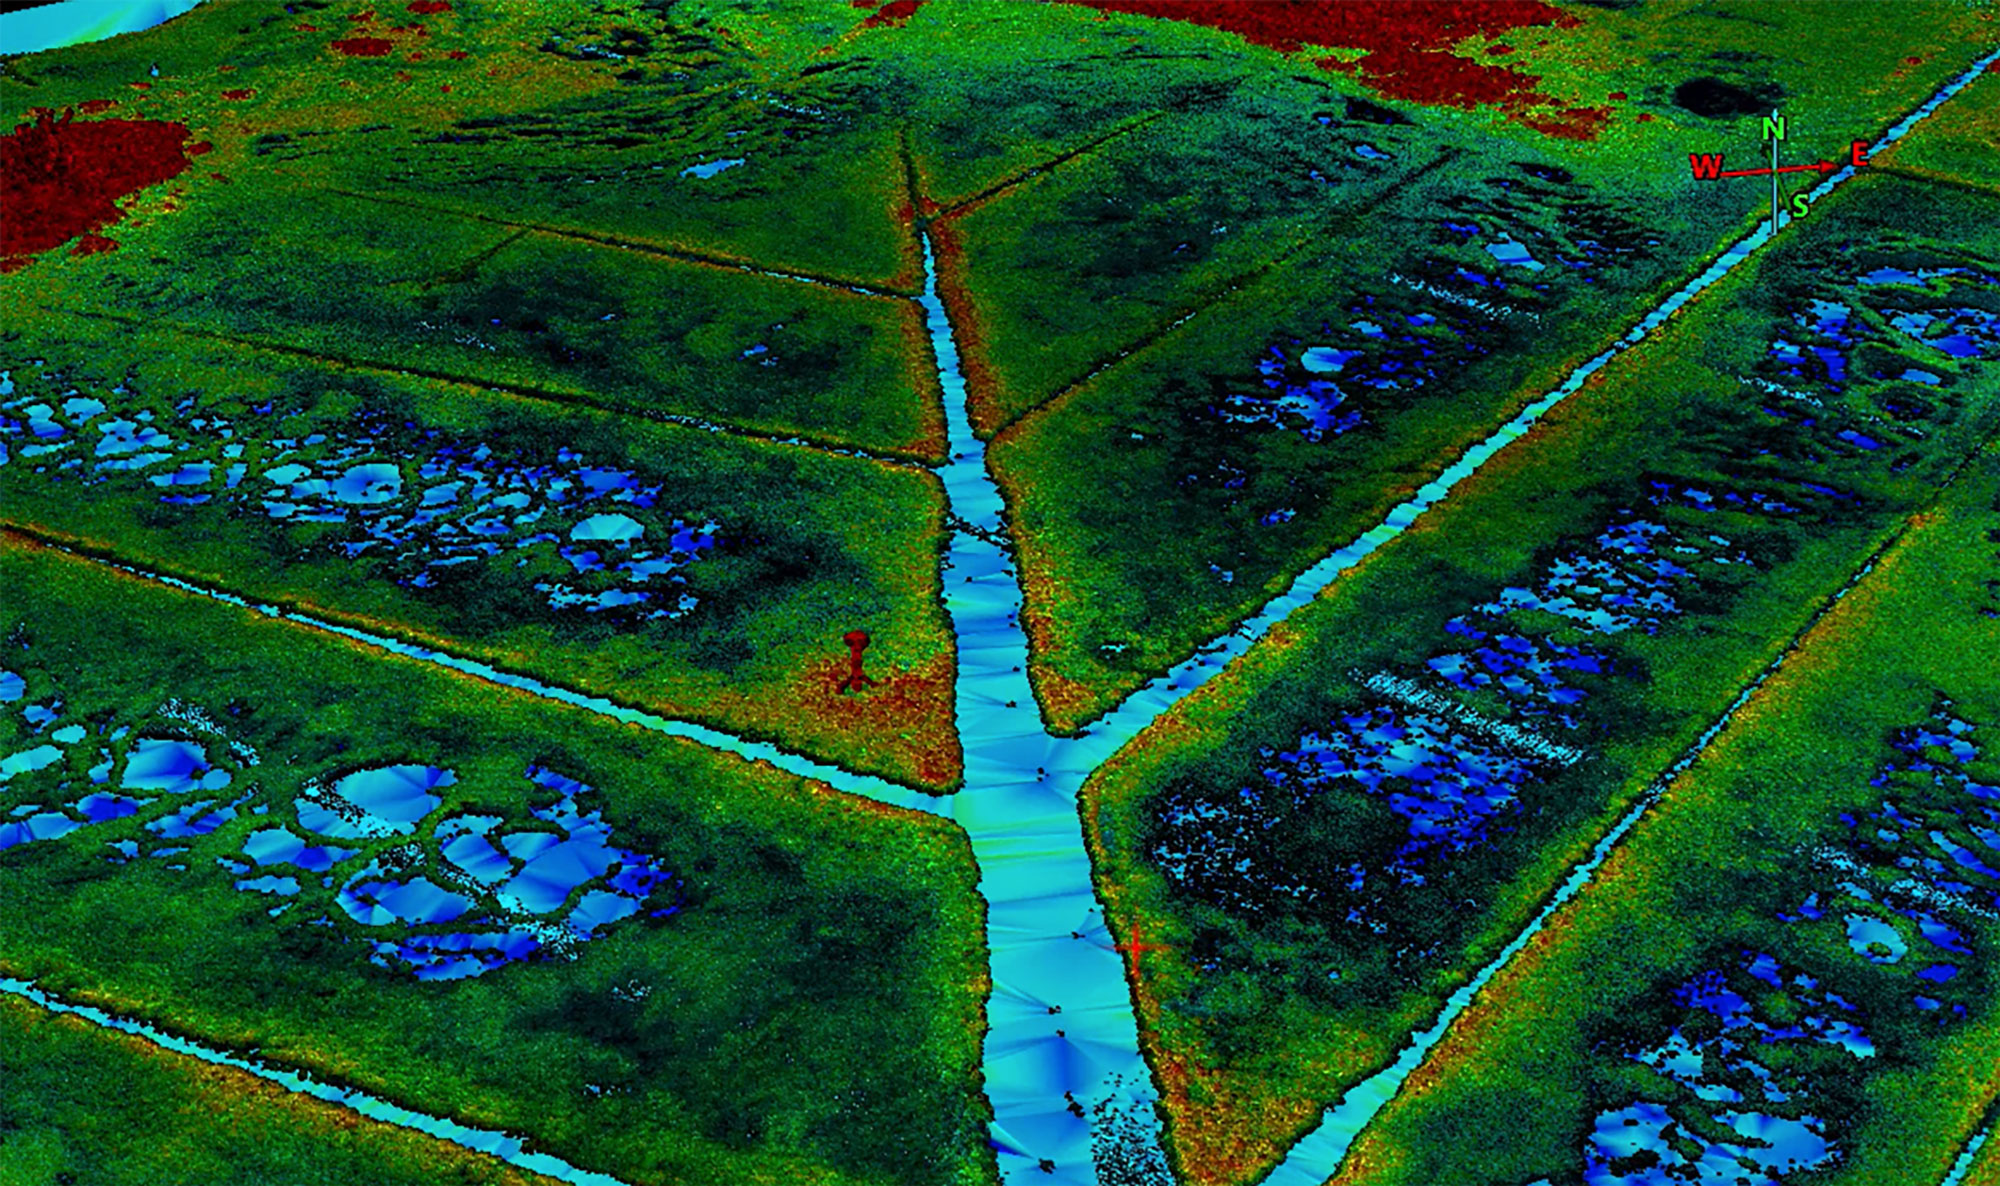
Top view of Barn Island point cloud with DTM

Solution: Aerial collection provides the data needed to build 3-D Models of the tidal marsh shoreline, and LiDAR, Thermal, Near Infrared and Orthomosasic processing can be used to provide likely locations of nest sites, as well as to inventory present marsh vegetation types such as Phragmites, Alternaflora, etc. Those processes output the following:
- High resolution orthomosaics
- Colorized point clouds
- Digital Terrain Models(DTM)
- Digital Surface Models(DSM)
- Elevation Contours
- Vegetation classification
- Change Detection
- Broad range indices generation
- Biomass identification
Results:
- Captured baseline data for thin layer placement restoration techniques that will be evaluated through change detection in the coming years.
- Nest sites visualized and recorded with water level baseline, bare earth models to visualize topography below the marsh
- Captured other key indicators of overall marshland health